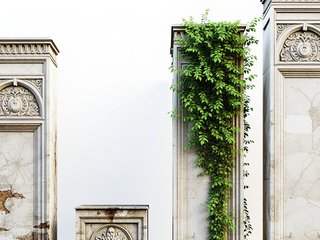
Ancient Columns
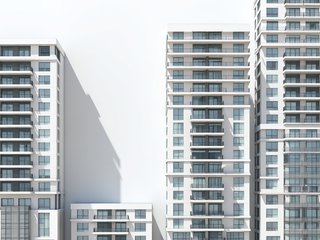
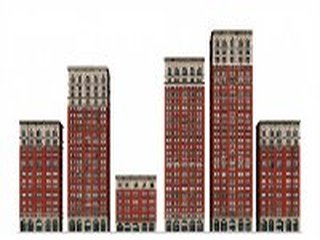
Apartment Buildings
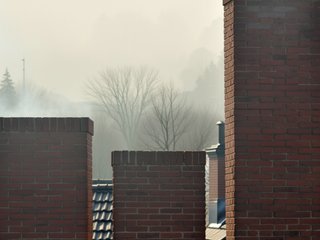
Brick Chimneys
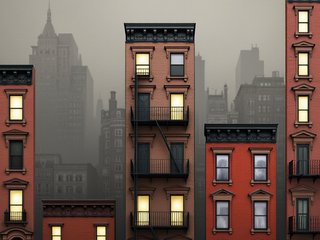
Brownstones
Chicago Art Deco
Chicago Brickwork
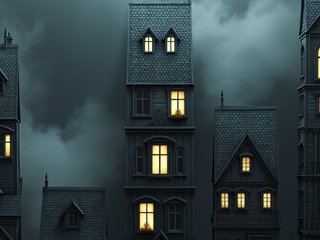
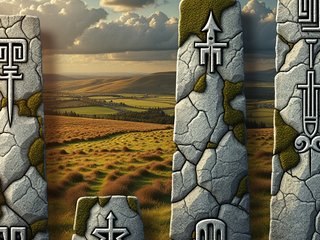
Gothic Houses
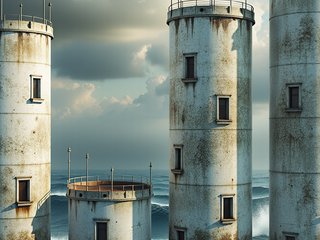
Lighthouses
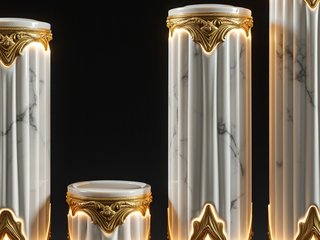
Marble Pillars
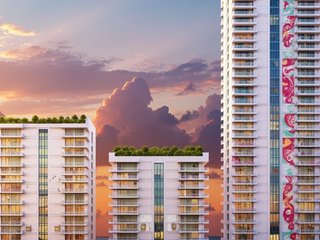
Miami Apartments
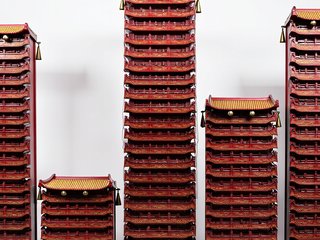
Pagodas
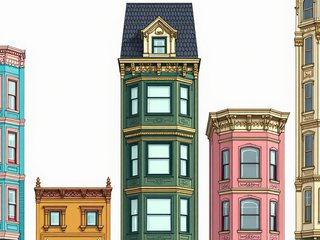
San Francisco Victorians
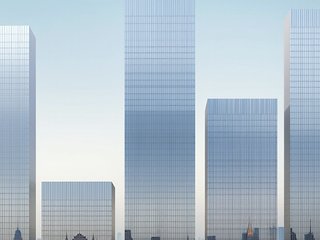
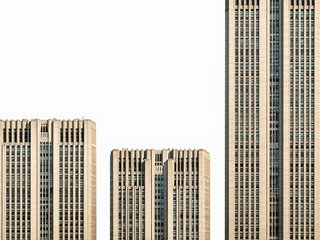
Skyscrapers (Day)
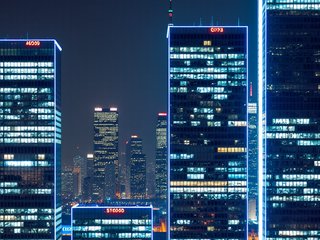
Skyscrapers (Night)
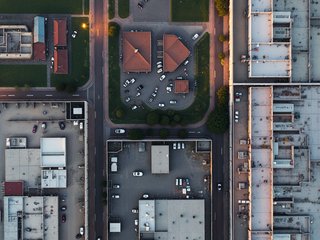
Urbanism
Augen Gneiss
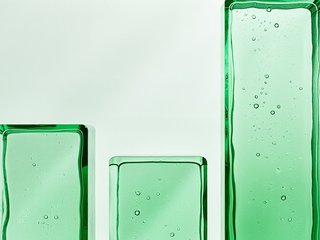
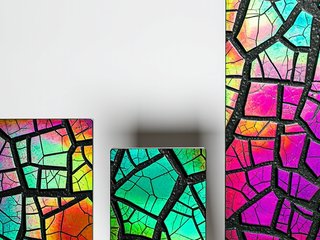
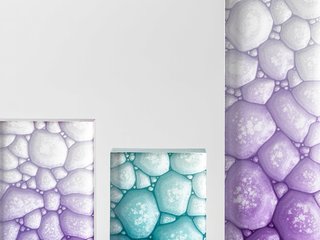
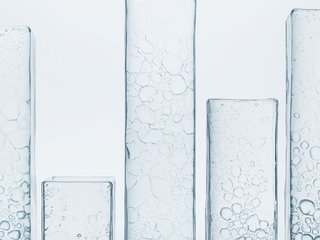
Bottle Glass
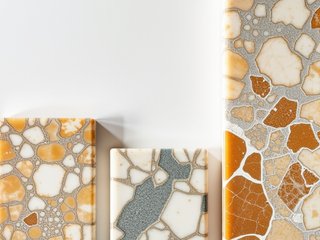
Brecha Arribada

Frosted Glass
Granite
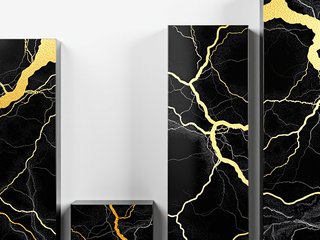
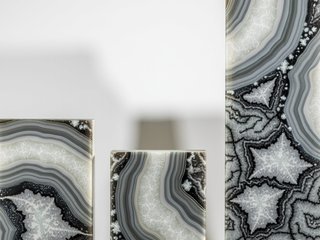
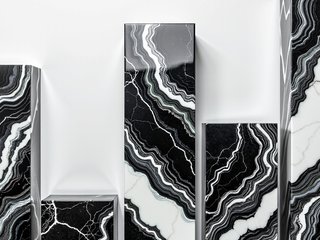
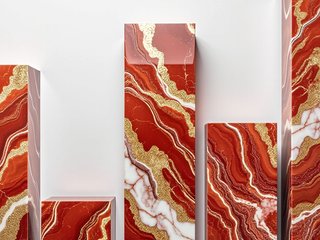
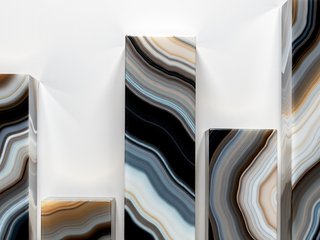
Marble - Black Gilded
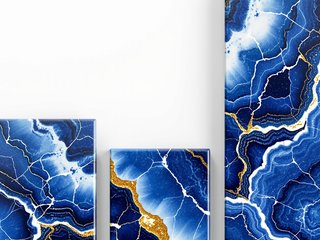
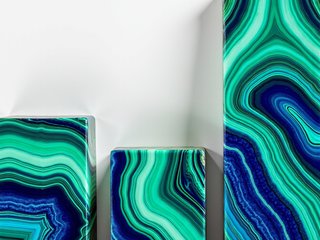
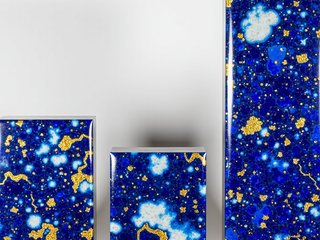
Marble - Blue Sodalite
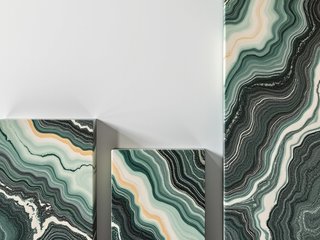
Marble - Cipollino
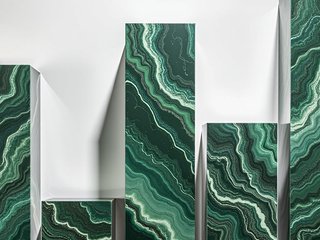
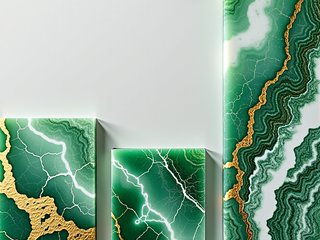
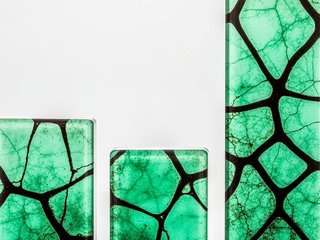
Marble - Green Serpentine
Marble - Harlequin
Marble - Pocahontas
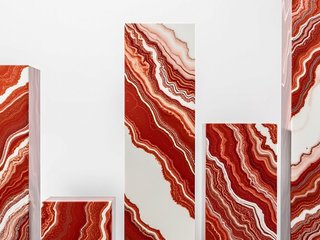
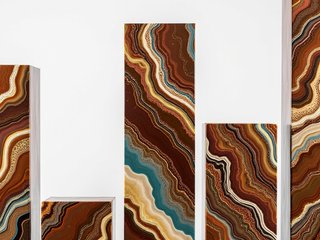
Marble - Rosso Levanto
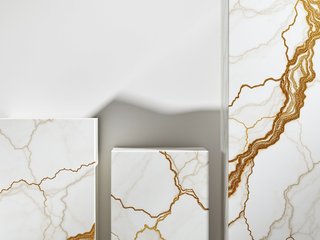
Marble - White Gilded
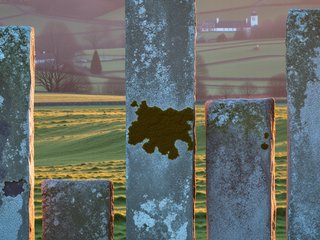
Monoliths
Murano Glass
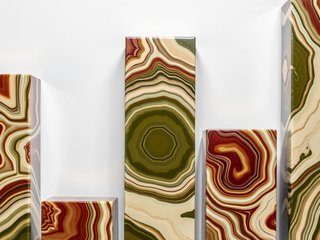
Onyx - Green
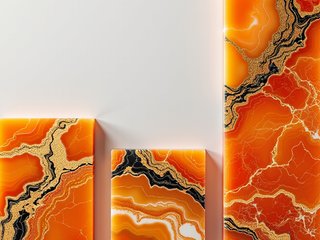
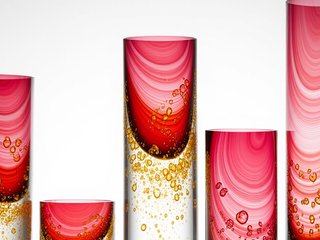
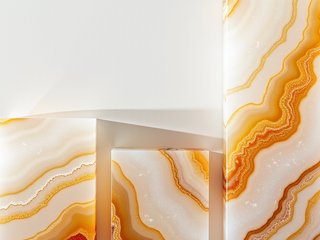
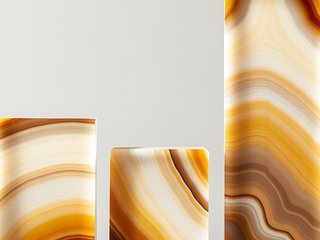
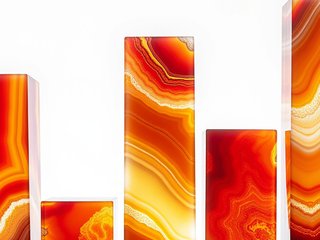
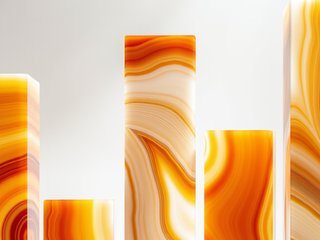
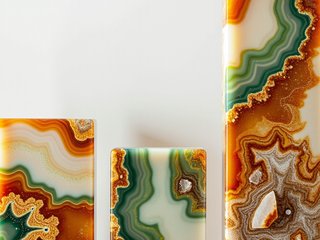
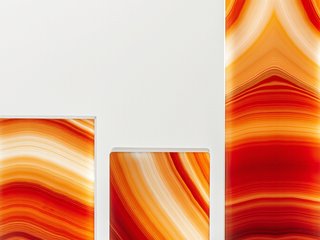
Onyx - Orange
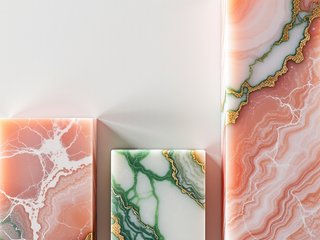
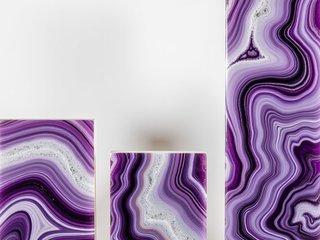
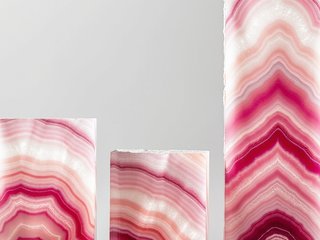
Onyx - Pink
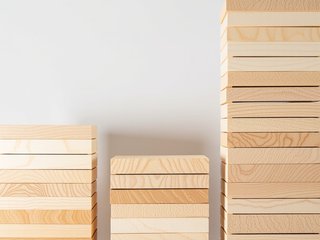
Planks
Red Quartzite
Sunlight Wave Quartzite
African Lace Agate
Ammolite
Azurite
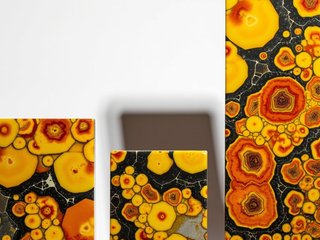
Bumblebee Jasper
Charoite
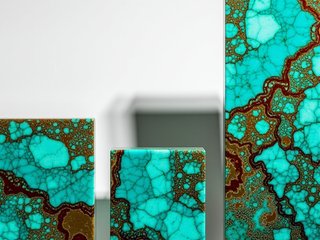
Chrysocolla
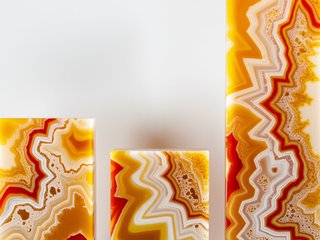
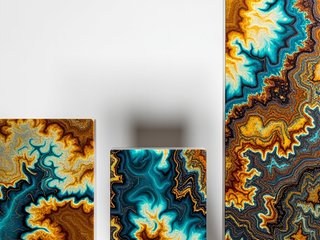
Crazy Lace Agate
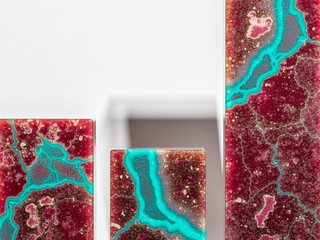
Crimson Cuprite
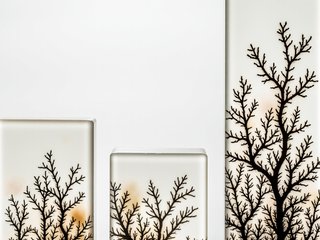
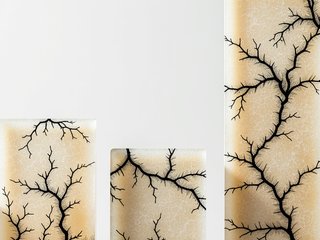
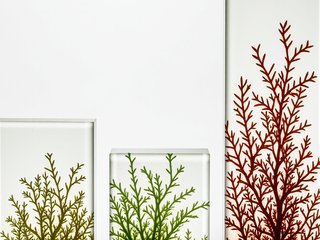
Dendritic Agate
Dendritic Quartz
Dendritic Siltstone
Eye Agate
Fairburn Agate
Fordite
Galaxy Jasper
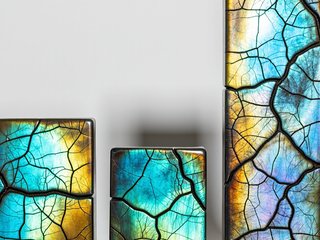
Labradorite
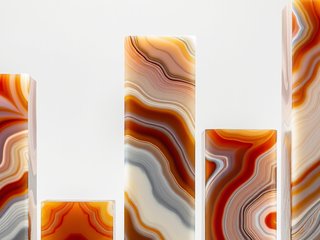
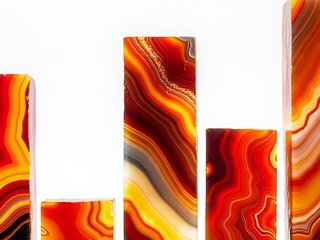
Laguna Agate
Lapis Lazuli
Madagascar Banded Agate
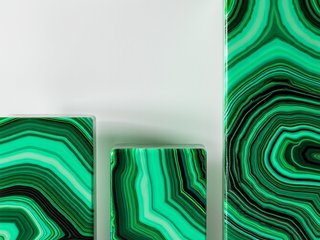
Malachite
Moss Agate
Ocean Jasper
Onyx - Carnelian
Pietersite
Rhodochrosite
Smithsonite
Trapiche Emerald
Tuxedo Agate
Watermelon Tourmaline
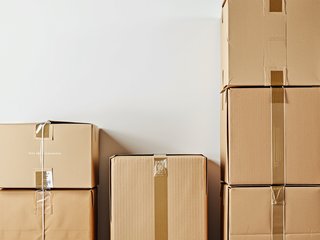
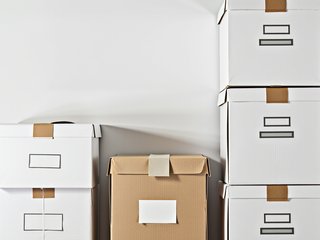
Cardboard Boxes
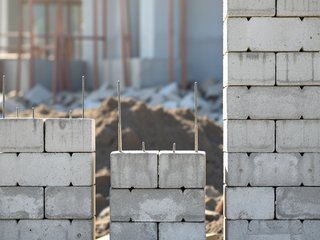
Cinderblocks
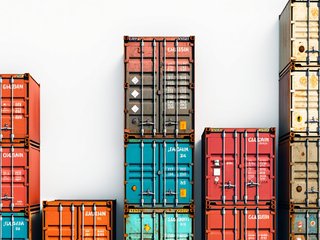
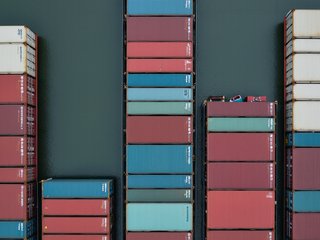
Containers
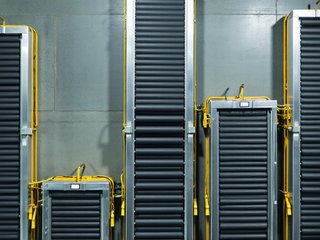
Conveyor Belts
Copper
Industrial Inferno
Machine Shop
Metallic Blue Paint
Metallic Gold Paint
Metallic Green Paint
Metallic Paint Mix
Metallic Red Paint
Metallic Silver Paint
Newsprint
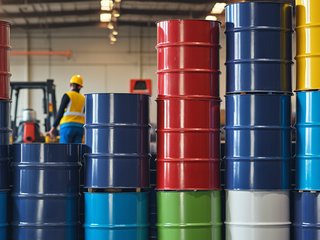
Oil Drums
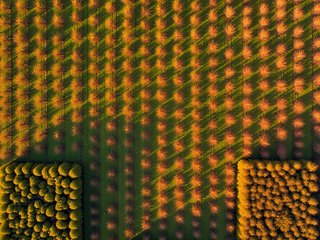
Orchard

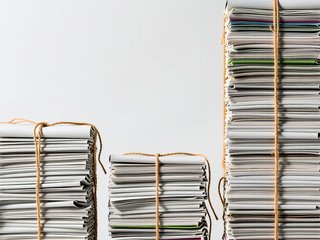
Paperwork
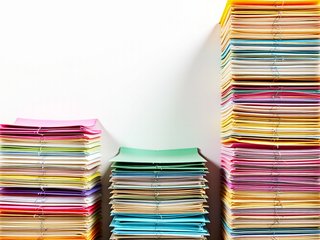
Paperwork (Colorful)
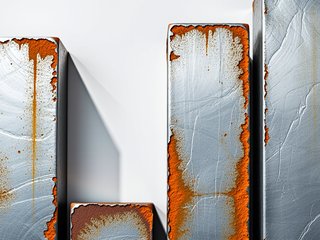
Rusty Steel
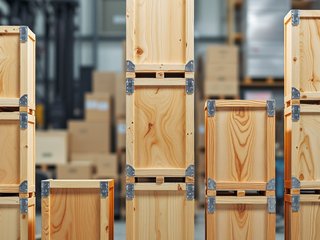
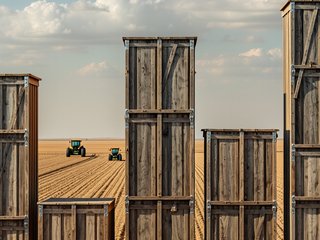
Shipping Crates
Stacked Produce
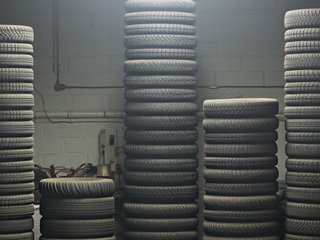
Stacked Tires
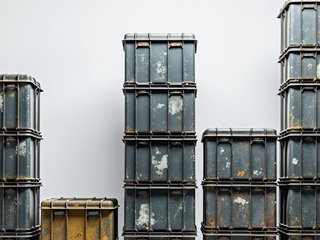
Stacked Totes
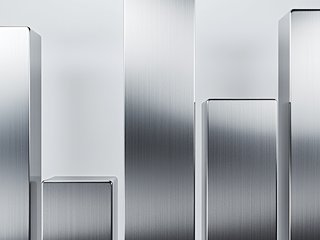
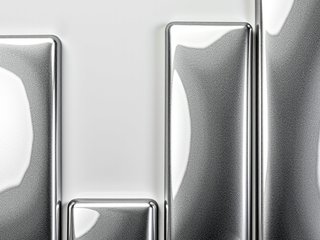
Stainless Steel
The Archive
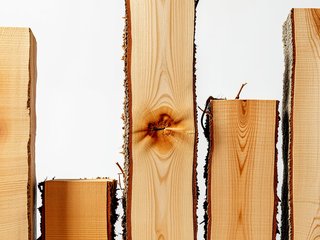
Timber
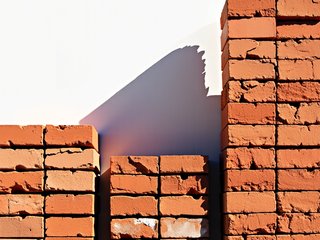
Used Bricks
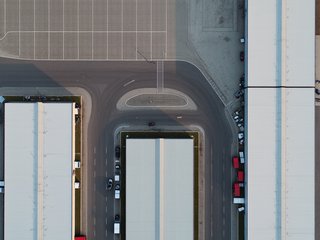
Warehouse Complex
Waterfront
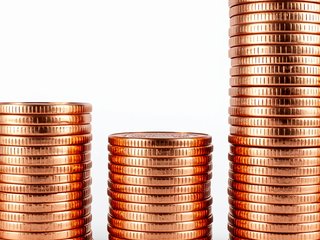
Copper Coins
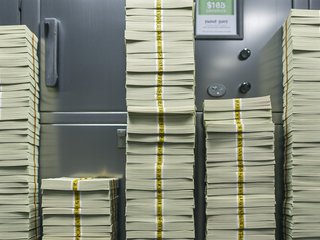
Currency
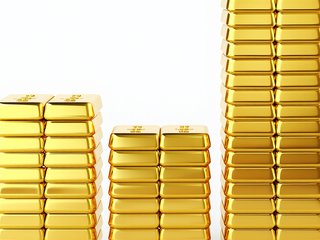
Gold Bars
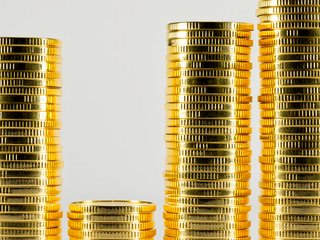
Gold Coins
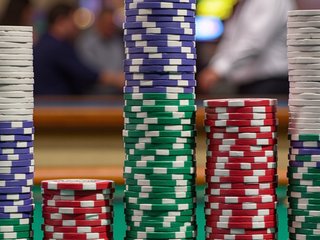
Poker Chips
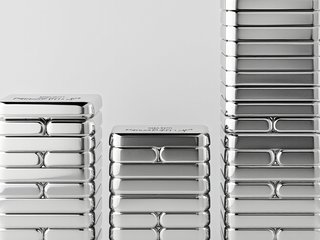
Silver Bars
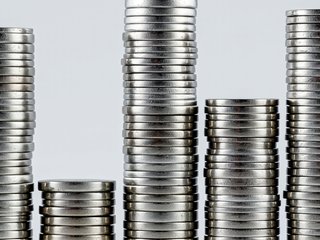
Silver Coins
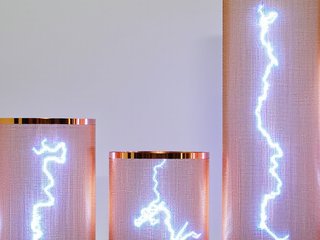
Faraday Cages
Glowing Data Cubes
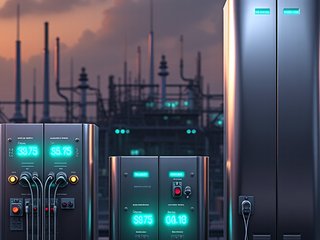
Industrial Fuel Cells
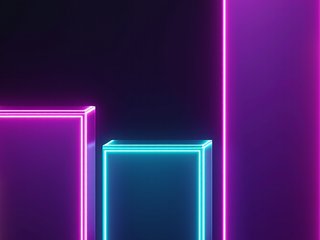
Neon Cyberpunk
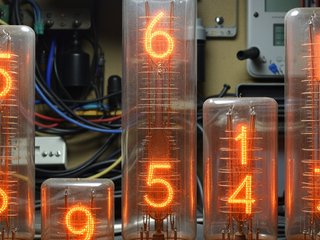
Nixie
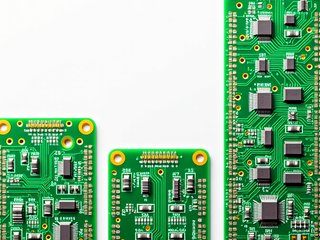
PCB

Server Stack
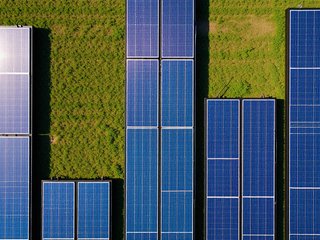
Solar Farm
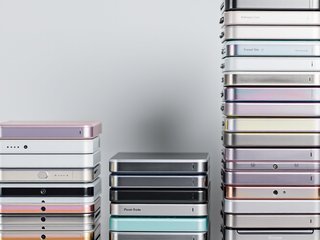
Stacked Cell Phones
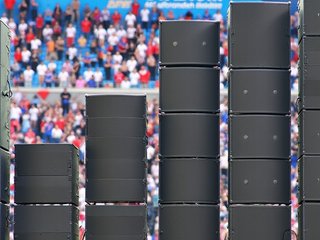
Stadium Speakers
Test Tubes
Base Model
Block Party
Earth Tones
Ethereal
Eye Candy
Eye Candy
Fluid Ink
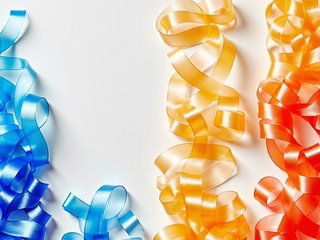
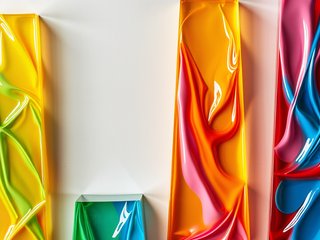
Gradient Ribbons
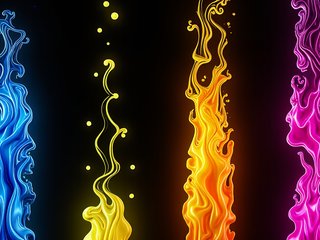
Liquid Neon
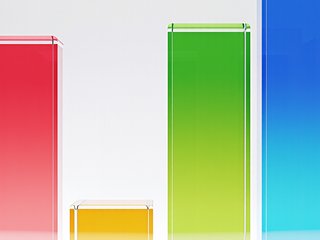
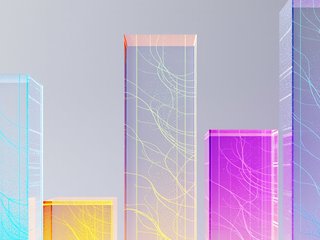
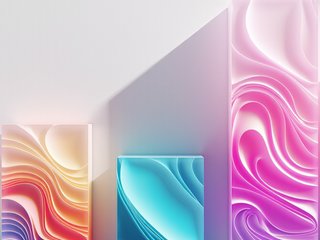
Lucite Blocks
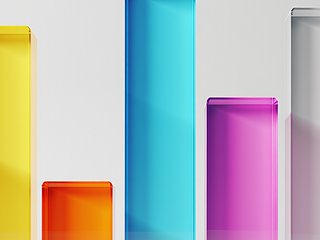
Lucite Blocks 2
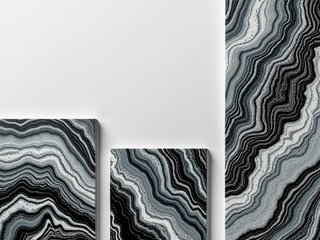
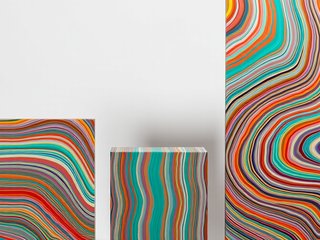
Monochrome Swirl
Nirvana
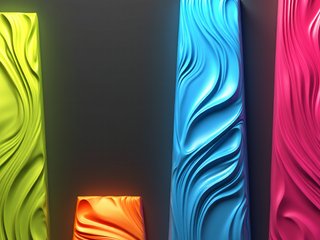
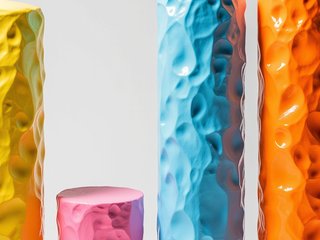
Organic Neon
Rainbow Smoke
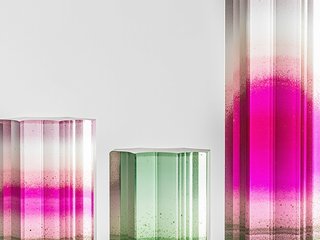
Tinted Glass
Vaporwave
Books
Clean Dishes
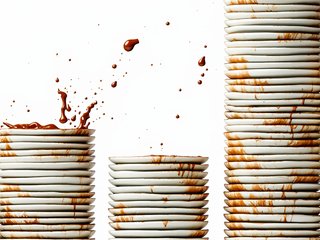
Dirty Dishes
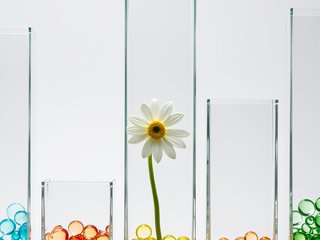
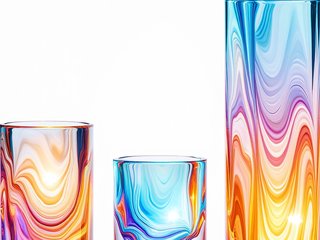
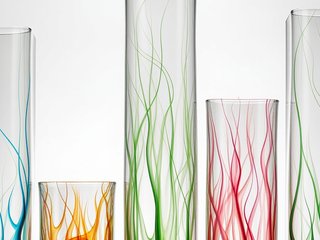
Glass Vases
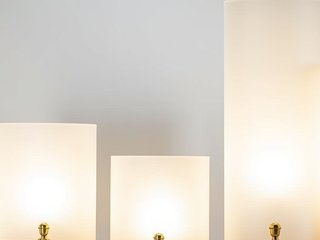
Lamps
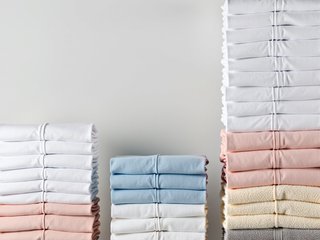
Laundry
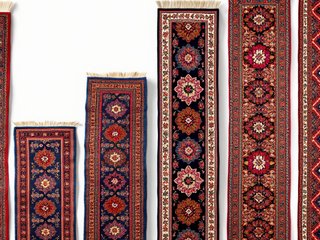
Persian Rugs
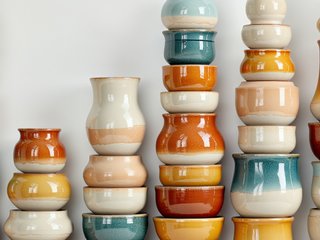
Pottery
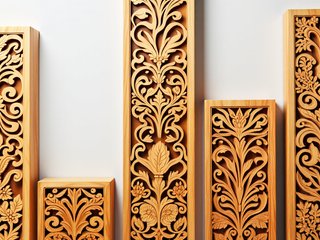
Scrollwork
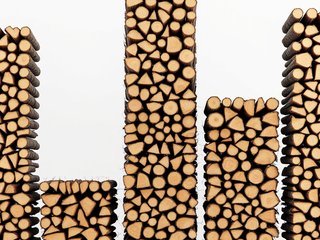
Stacked Firewood
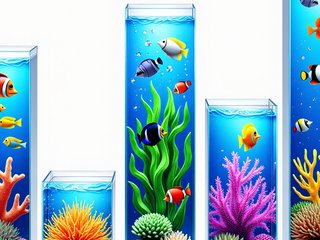
Aquariums
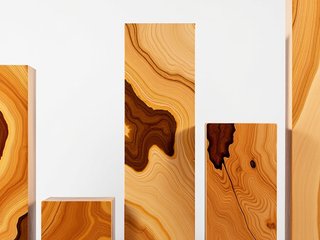
Burled Hickory
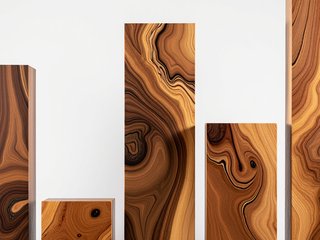
Burled Walnut
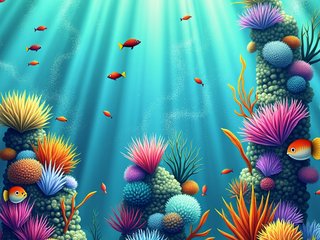
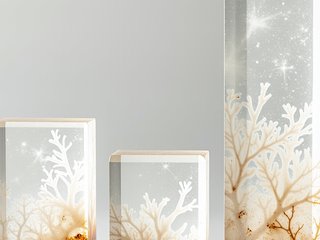
Coral Reef Pillars
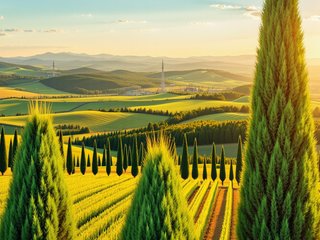
Cypress Trees
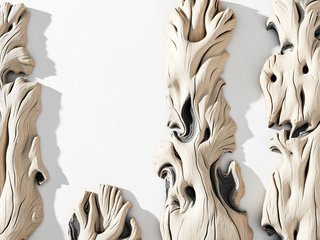
Driftwood
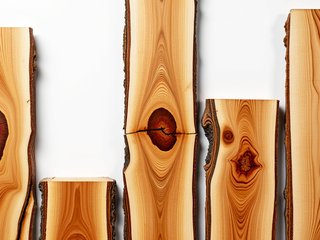
Live Edge Wood
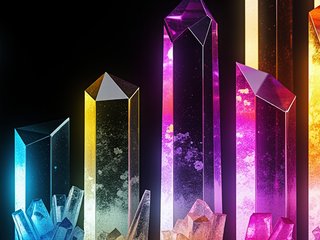
Rainbow Crystal Formations
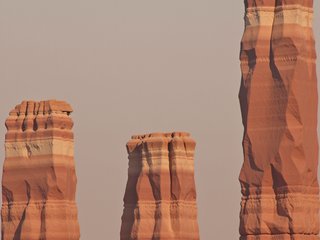
Rock Pillars
Tiny Bubbles
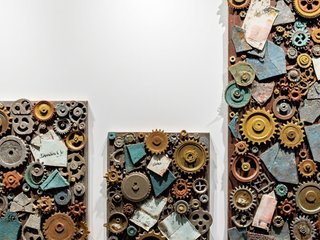
Assemblage Art
Blown Glass
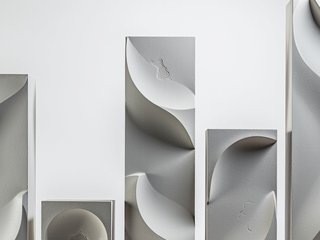
Concrete Sculptures
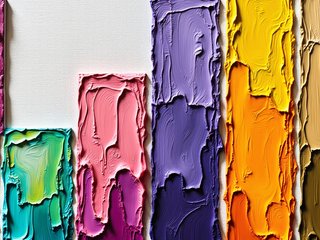
Impasto Oil
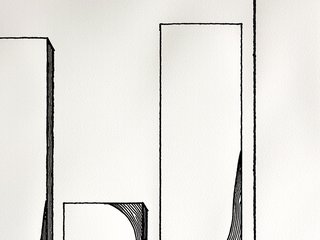
Pen and Ink
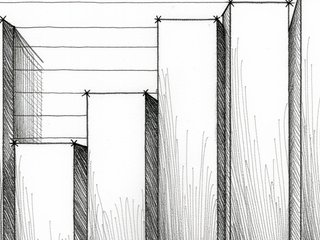
Pencil Sketch
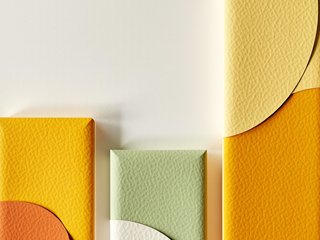
Retro 70s
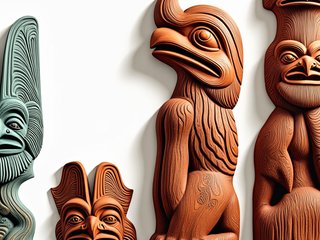
Totem Poles
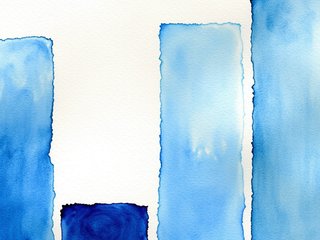
Watercolor Blues
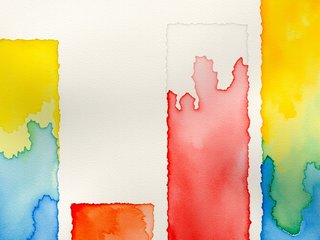
Watercolor Cheerful
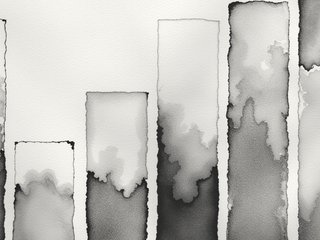
Watercolor Grays
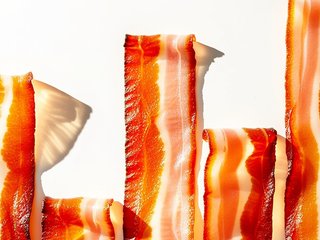
Bacon
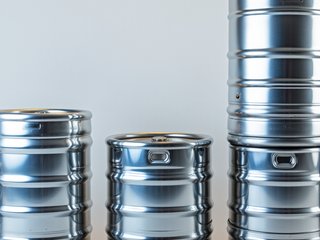
Beer Kegs
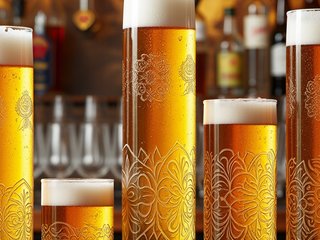
Beer Steins
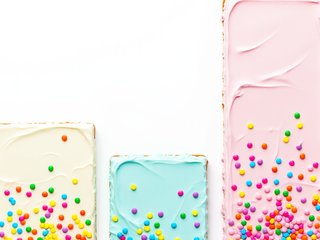
Birthday Cake (Kids)
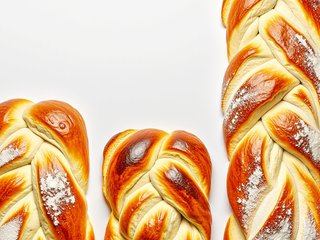
Braided Bread
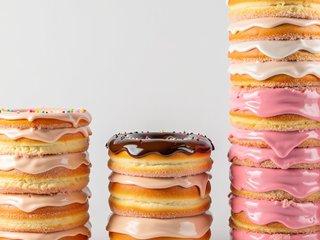
Donuts

Gingerbread Houses
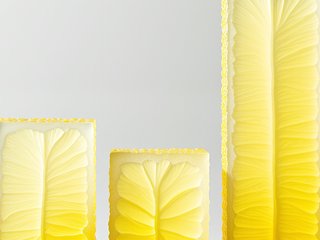
Lemon Slices
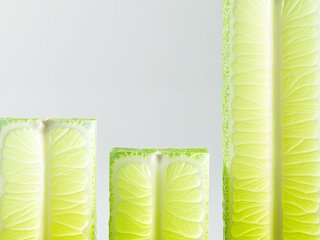
Lime Slices
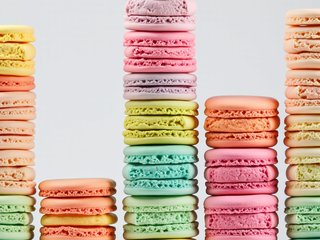
Macarons
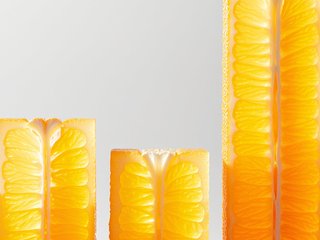
Orange slices
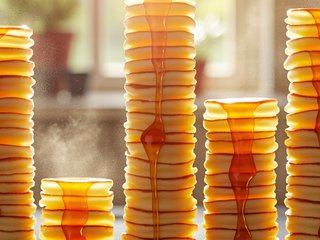
Pancakes
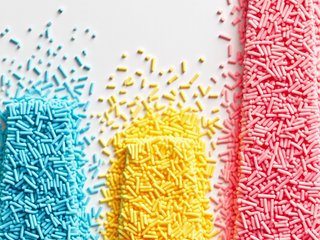
Sprinkles
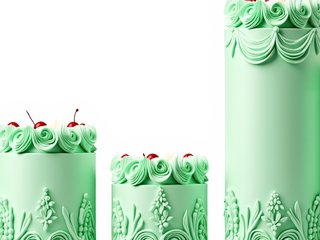
Vintage Lambeth Cake
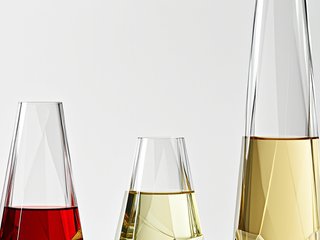
Wine Carafes
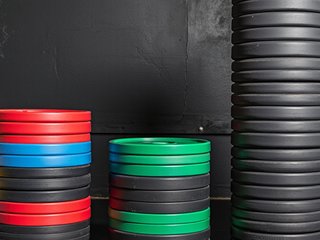
Bumper Plates
Clay
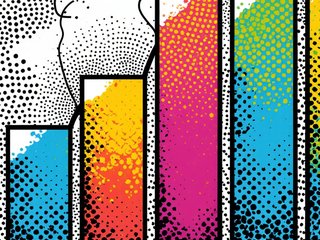
Comic Pop Art
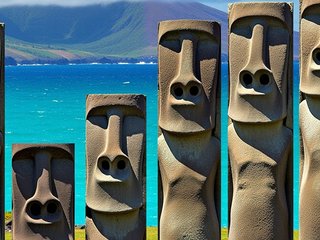
Easter Island Moai Statues
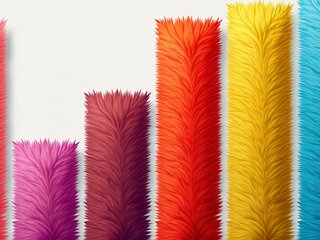
Fluffy
Graffiti
Lava Lamps
Low Poly Landscape
Luggage
Stonehenge
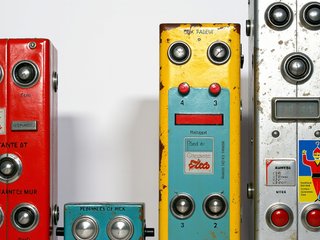
Vintage Toy Robots