Faraday Cages
Future Robotics
Glowing Data Cubes
Industrial Fuel Cells
Neon Cyberpunk
Nixie
Oscilloscope
PCB
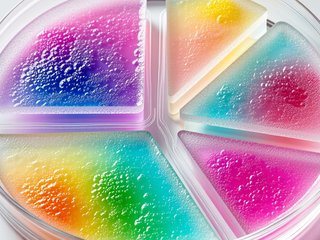
Petri Dish
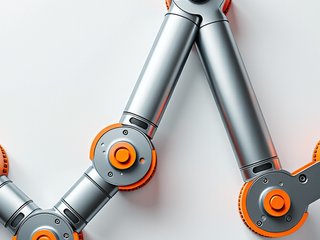
Robotics

Server Stack

Silicon Wafer
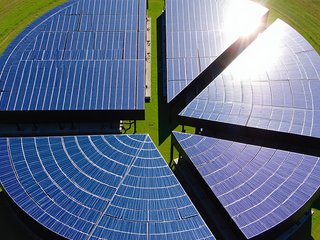
Solar Farm
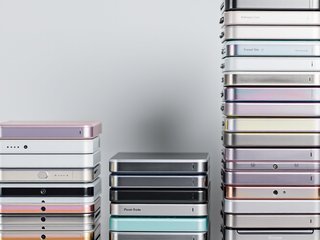
Stacked Cell Phones
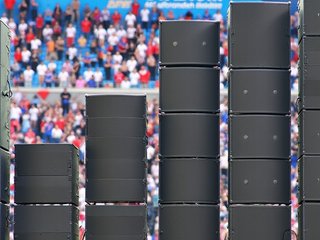
Stadium Speakers
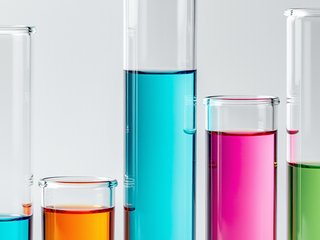
Test Tubes